The Boomer Blockade, Six Years Later
An update to the original January 2020 post, using Federal Reserve Distributional Financial Accounts data through Q4 2025 and the 2025 Crist Kolder Volatility Report.
When I wrote The Boomer Blockade in January 2020, my hot take-away was that the best predictor of becoming a CEO of a Fortune 500 company was being a baby boomer. The Crist Kolder data that inspired the piece showed the average birth year of newly appointed CEOs hadn’t budged from Boomer territory since 2005.
Six years later, that’s no longer true.
Average birth year of appointed CEO, 2010–2025
Crist Kolder Volatility Report · F500 and S&P 500 · age at hire

In 2010 the average appointed CEO was born in 1960 — solidly Boomer. The line drifted upward through the 2010s, sitting on the Boomer/Gen X boundary for most of the decade. In 2023 it crossed into Gen X for the first time. By 2025 it was 1967.
The best predictor of becoming a CEO is no longer being a Boomer. As of 2023, it’s being Gen X.
Congrats to Gen X. The Boomer blockade is over.
Or is it? Let’s dig in.
The Silent Generation controlled nearly 80% of wealth at the end of the 1980s, but the Boomer generation rode a wealth boom into older age
In the original post I showed a chart from Federal Reserve data on wealth adjusted for median generation age. It showed the Silent generation’s share of household wealth shrinking sharply starting in their 50s while the boomer share kept growing as the median member of the cohort was entering their 60s.
Here’s what I wrote at the time
If you compare the boomers to the silent generations, the silent generation’s share of wealth shrunk 26% from a median cohort age of 54 to 63 years old. During the same comparable period, the baby boomers increased their share of wealth by 5%. The baby boomers are growing their share of the pie into their sixties.
I went back to the Fed’s Distributional Financial Accounts and pulled all the data through Q4 2025.
When I first looked at the data in 2019, the boomers had already plateaued but I couldn’t quite predict how it would evolve. It turns out that it had already started declining, with the peak being late 2016 at 57.6%.
Six years later, the millennial and gen X cohorts are the ones gaining share of wealth:
Share of US household wealth by median cohort age
Federal Reserve Distributional Financial Accounts, Q4 1989 – Q4 2025

Part of this is that the Boomer population has shrunk and another part is that many are shifting into retirement (especially a big bump during the pandemic).
Overall the boomer share has fallen from 57.6% to 51% over nine years. Silent share keeps dropping too. But if we look at the cohorts, most of what Boomers and Silent lost went to Millennials, who climbed from 4% to 11%. Gen X barely moved, 25% to 26%.
Gen X at a median age of 52 holds 26% of household wealth. In terms of nominal gains, it was a huge increase, but if you are comparing to the dominance the Boomers had at the same age, they are only half of the Boomers 50% of share.
The big story from 1989-2025 was that the Boomers captured the majority of the new wealth created.
Who captured new wealth, 1989–2025
Federal Reserve DFA · change in nominal wealth held by each generation · total new wealth: $154.4T

Part of this is that the Boomers were just bigger than every other generation. Another part is that their careers and lives coincided with a reshaping of the financial reality of American adults. Starting with the Boomers, the limits on wealth expansion in old age no longer seem to apply.
The bigger question…are the Millennials and Gen X left behind?
Turns out it’s complicated.
Gen X and Millennials are doing just as well as Boomers, but you have to adjust for inflation and cohort size
Total wealth has expanded at an unprecedented pace over the past fifteen years.
Similar to the above chart, the Boomers really were the first generation to see wealth continue to increase as they approached retirement.
Total household net worth by median cohort age
Federal Reserve DFA · Q4 1989 – Q4 2025 · nominal dollars

As we can see, Boomers as a generation have amassed $89.7 trillion at a median cohort age of 70. The Silent generation never broke $30T.
The obvious challenge here is that a 1989 dollar is worth far more than a 2025 dollar. So let’s adjust the same chart for real 2025 dollars.
Every cohort’s wealth at every age converted to today’s purchasing power using CPI-U:
Total household net worth by median cohort age (real 2025 dollars)
Federal Reserve DFA, deflated by CPI-U · Q4 1989 – Q4 2025

With these we see Gen X still “losing” to the Boomers and the Silent generations slide being a bit more dramatic.
But wait, you say. What about cohort size? Aren’t the Boomers a massive cohort?
Yes, good call.
I pulled population and you can see that the population sizes have shifted over time with the Millennials actually continuing to grow over time, too, because of immigration.
While Boomers were the largest cohort for most of this window, Millennials passed them around 2018. Gen X stayed smaller than both. Silent shrank as people passed away.
US population by generation, 1989–2025
Census Bureau annual population estimates by single year of age, summed across each generation's birth-year range

Now dividing wealth by that cohort size:
Per-capita household net worth by median cohort age (real 2025 dollars)
Federal Reserve DFA ÷ Census Bureau annual cohort population · Q4 1989 – Q4 2025

This gives us a more coherent picture of what’s going on:
The Boomers are behind where the Silent generation was at mid-life, but unlike the Silent generation, their wealth continued to rise in their 60s and 70s. In 1989 the Silent generation held roughly 80% of US household wealth despite being only ~17% of the US population (42.4M out of 246.8M Americans). For comparison, Boomers in 2025 hold 51% of US household wealth at ~20% of the population (66.6M out of ~340M) — a similar population share, but a much less extreme wealth concentration (~2.6x over-indexed vs Silent’s ~4.7x in 1989). That 1989 Silent concentration produced about $1.0M per capita at median age 52 — more than Boomers had at the same age in 2007 ($648K per capita), even after adjusting for inflation, because the Boomer cohort was nearly twice as large (77.9M people sharing a similar pool of wealth). What’s distinctive about Boomers is what happened after 60: per-capita wealth kept climbing to $1.35M at age 70 today, vs $1.15M the Silent generation held at 70 in 2007. Silent plateaued. Boomers didn’t.
Gen X at 52 have much less share than what Boomers had, but adjusted for inflation and cohort size, they are ahead of Boomers. Per capita in 2025 dollars, Gen X at 52 holds $718K ($46.2T ÷ 64.4M people). Boomers at the same age in 2007 held $648K ($50.5T real ÷ 77.9M). Silent at 52 in 1989 held $1,006K ($42.7T real ÷ 42.4M — the Silent cohort was barely half the size of Boomers, so the same pool of wealth concentrated into fewer people). Gen X is ~10% ahead of where Boomers were at 52, and both are well below where Silent was at the same age once you account for the smaller Silent cohort.
Millennials at 35 are well ahead of everyone. Per capita in 2025 dollars, Millennials at 35 hold $256K. Boomers at 35 (in 1990) held $136K. Gen X at 35 (in 2008, mid-financial-crisis) held $93K. Millennials are roughly 1.9x ahead of Boomers and 2.8x ahead of Gen X at the same age. This is an underrated trend (see Nick Maggiulli on this for a similar take).
I think the biggest takeaway is under-discussed:
The Boomer generation is the first financialized generation. It’s very clear that something shifted in the economy in terms of wealth accumulation with the boomer generation. I suspect a big contributor to this is shift away from defined pension plans and the rise of equity investing like 401ks as opposed to defined pension plans. With this shift, the Boomers are the first ones who truly are a native capitalist generation from early age until old age.
Perhaps it also explains this other chart I’ve shared in the past:
The boomers have captured the biggest share of all wealth expansion since 1990 but that has shrunk over time
Even though half of their generation is likely retired, the Boomer generation still captured the largest share of new wealth in the last ten years:
Who captured new wealth, 2015–2025
Federal Reserve DFA · change in nominal wealth held by each generation · total new wealth: $90.5T

Boomers captured nearly half, despite many hitting retirement. Gen X picked up another third.
It wasn’t always this distributed. Here are the same charts for the three prior decades, drawn on the same x-axis scale so the dollar magnitudes are comparable:
Who captured new wealth, 1990–2000
Total new wealth created over the decade: $20.6T

Who captured new wealth, 2000–2010
Total new wealth created over the decade: $20.3T

Who captured new wealth, 2010–2020
Total new wealth created over the decade: $60.8T

Three things stand out.
First the big one: Boomers have captured the largest share of wealth for the last 35 years. Again, we know from the Silent generation data that this was not happening because the Boomers were already out-wealthing them in 1990. This is a permanent shift in how the economy works and distributes wealth to people. The rich get richer, but more broadly, every generation is getting richer too.
The boomers dominated the early 2000s but capture has slowed from 61% → 86% → 52% → 46%. In the 2000s boomers captured almost every new dollar created in the entire economy, because the Silent generation was losing wealth and Gen X and Millennials hadn’t accumulated enough to register. Only in the last fifteen years did the pattern broaden, and even then boomers still got more than anyone else.
Gen X’s has caught up, their share doubled each decade. From 11% in the 1990s to 18% in the 2000s to 41% in the 2010s. Despite this, they are still second to the Boomers in terms of capturing new wealth despite its oldest cohort members approaching retirement.
In 2025, Millennials are still behind the Silent Generation in terms of total wealth and people older than 62 have nearly two thirds of all wealth
This is often the view you see shared online. Obviously there is some nuance to this as we just covered, but the most striking thing is that nearly two-thirds of all wealth is controlled by people aged 62 and older.
Total household net worth by generation, over time
Federal Reserve DFA · Q4 1989 – Q4 2025 · nominal dollars

While the Silent generation controlled substantial wealth later in life, they were actually capturing less of a share of the wealth than their children (the boomers) in their 50s and 60s.
Despite this, someone shared the following graphic with me from the 80s:
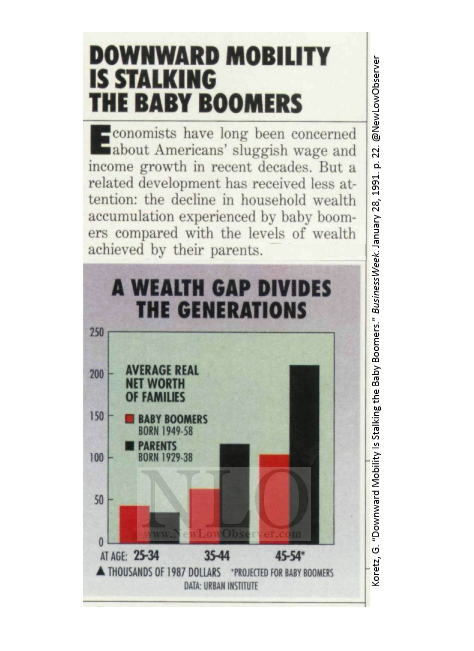 I guess old people complaining about young people and young people complaining about older people is a timeless tradition.
Zooming out, the trends I shared in the original Boomer blockade piece still stand
The 2020 post talked about three ideas.
- Career disruption: Slower growth, less stable economy
- Pseudo career paths: First generation staying longer in the workforce meant average ages for executive roles increased
- Wealth Capture: New with Boomers = capturing the most wealth - still true
Here’s a quick accounting on the most recent data::

A couple themes that I think are driving some of the discontent toward older generations despite the fact that overall wealth seems somewhat okay:
-
The career blockade is ending. But there is still a lot of frustration with housing. The CEO line crossed into Gen X in 2023. The youngest Boomer turns 62 this year, the oldest 80. Housing went the other way. The median first-time buyer is now 40 (or 33 per CFPB, both records), up from 29 in 1981. House prices ran 5x median household income in 2025, up from 3.5x in 1985. Boomer homeownership at age 27 was 40.5%; today’s under-30s are at 32.6%. Half of US renters now spend more than 30% of their income on rent — the highest reading the Harvard Joint Center for Housing Studies has ever recorded.
-
The promised wealth transfer arrives after the years it was supposed to help. Cerulli now projects $124 trillion will move from Boomers to heirs and charities between 2024 and 2048, up from their 2020 estimate of $84T. The median American receives an inheritance around age 51, and closer to 60 once a surviving spouse holds it first. Many young people who are getting help, are getting lump sums to help with down payments on housing at 25 to 35 or Kids’ college tuition at 45 to 55. However, many Boomers didn’t get help themselves and don’t see that they should be helping their kids either.
Challenging my own data
I asked Claude to critique my article with real data. Here are the caveats and nuance is flagged:
Cohort size matters — see the per-capita chart above. This is the biggest qualifier on the rest of the post. The DFA reports wealth by generation as a share or total, not per capita. Boomers number 66.6 million in 2025 (down from ~78 million at their late-1990s peak). Gen X is 64.4 million. Millennials are 73.1 million. Silent is just 14.7 million now (down from ~42 million in 1989). Source: Census Bureau Population Estimates, summed by single year of age.
Same-age per-capita comparisons (real 2025 dollars):
- At age 52: Silent $1,006K (1989) · Boomer $648K (2007) · Gen X $718K (2025)
- At age 35: Boomer $136K (1990) · Gen X $93K (2008) · Millennial $256K (2025)
- At age 70: Silent $1,150K (2007) · Boomer $1,346K (2025)
Two things change once you account for cohort size:
First, Silent at 52 had more per-capita wealth than Boomers at 52 — about $1.0M vs $650K. Silent is a smaller cohort (about half the size of Boomers at the comparable life stage), so spreading their wealth across fewer people produces a higher per-person figure. The original 2020 framing of Boomers being uniquely wealth-rich in middle age doesn’t survive the per-capita check perfectly but the Boomers wealth-building in later years is new.
Second, Gen X at 52 is roughly 10% ahead of Boomers at 52 in per-capita real terms. And Millennials at 35 are nearly 2x Boomers at 35.
The real Boomer phenomenon shows up at 70: $1.35M per capita, slightly ahead of Silent’s $1.15M at the same age. That’s the gap that holds up after every correction. The middle-career story doesn’t.
Wealth is concentrated inside each cohort, too. The top 10% of any generation holds most of that generation’s wealth. The “average Boomer with $1.25M” doesn’t exist. Median Boomer net worth is closer to $400K. Same caveat for Gen X and Millennials. Generational comparisons hide bigger gaps within each cohort.
The CEO chart stitches two methodologies. 2010-2014 comes from the 2021 Crist Kolder Volatility Report; 2015-2025 from the 2025 edition. The small step at 2014→2015 reflects a sample-definition change between editions, not a real demographic shift.
Housing data spreads wide. NAR’s 2025 first-time-buyer age is 40 (a record). The CFPB’s National Mortgage Database shows 32-33 (also a record, smaller increase). Both are real. NAR’s number reflects a smaller sample of survey respondents; CFPB’s reflects mortgage originations. The direction is the same; the magnitude is contested.
Generation boundaries are not consensus. I’m using the Fed’s definitions throughout: Silent 1928-1945, Boomer 1946-1964, Gen X 1965-1980, Millennial 1981-1996. Pew agrees. The Census Bureau uses slightly different boundaries. Shifting boundaries by a few years moves all the cohort numbers around.
Sources: Federal Reserve Distributional Financial Accounts, Q4 1989 – Q4 2025, for all wealth charts. Crist Kolder Volatility Report, 2025 edition, for the CEO chart. Wealth charts use Q4 readings; cohort positioning uses the midpoint of each generation’s birth-year range. The original 2020 post lives at pmillerd.com/the-boomer-blockade.
Join 25,000+ curious readers
Reflections on life, work, and what really matters